Performance Support Toolkits
This was an 18-month project to design a series of toolkits to enable the Product and Service Managers drive workforce adoption of new IT applications, reduce support calls for the new apps, and align specialized resources to complex projects in a consistent manner.

Role
My role was to conduct user research (in consultation with the UX Research Center of Excellence), design and test wireframes and prototypes, and develop, launch, and improve the toolkits as an ecosystem.
I designed 4 toolkits for a combined total of about 35 pages and subpages, outlined the service blueprint line of interaction with the user and catalyzed service owners to automate gaps, created the page and ecosystem key performance indicators and metrics reports, and connected and measured the user journey across enterprise platforms (Slack, Degreed, and SharePoint). I also designed content for the pages such as the application ecosystem graphic, how-to have a conversation about education guide and a how-to-guide template.
Process
My design process followed the company’s design process.

Initial user research included landscape analysis across similar internal sites, departments, and tools, and contextual inquiry of expected users through field interviews. I created wireframes in Balsamiq, GSlides, and Vyond (animation) and prototypes in Figma and Lumapps.
In some cases, user testing included Optimal Workshop card sorting. I managed the feature backlog in GSheets.
Example: Case Study 1
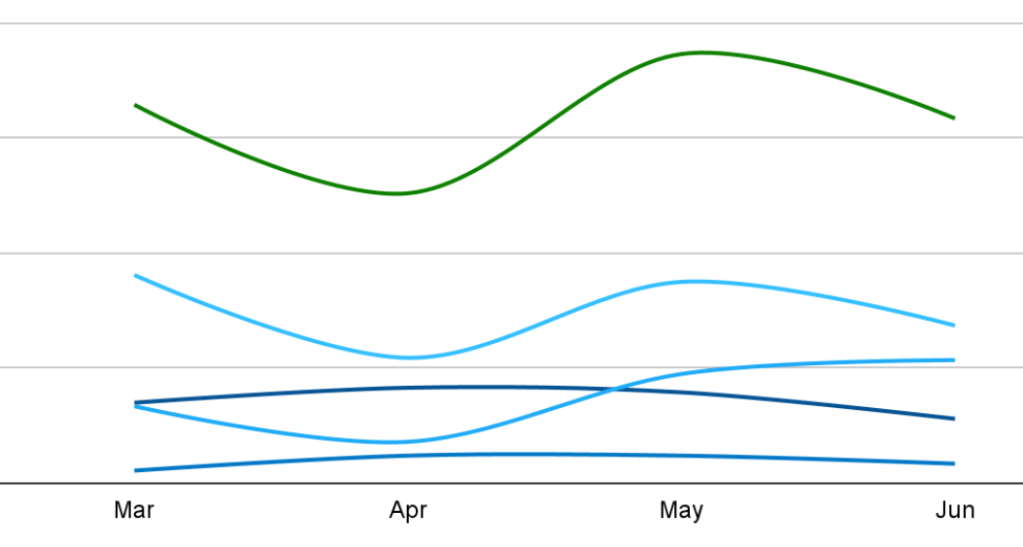
I tested designs with users through the Follow Me Home process. Together with a moderator and note taker, we asked the user to complete tasks and we asked for feedback which I arranged in empathy maps and rainbow charts. Each test gave me valuable information about what needed to change in the design and why.

Example: Case Study 2
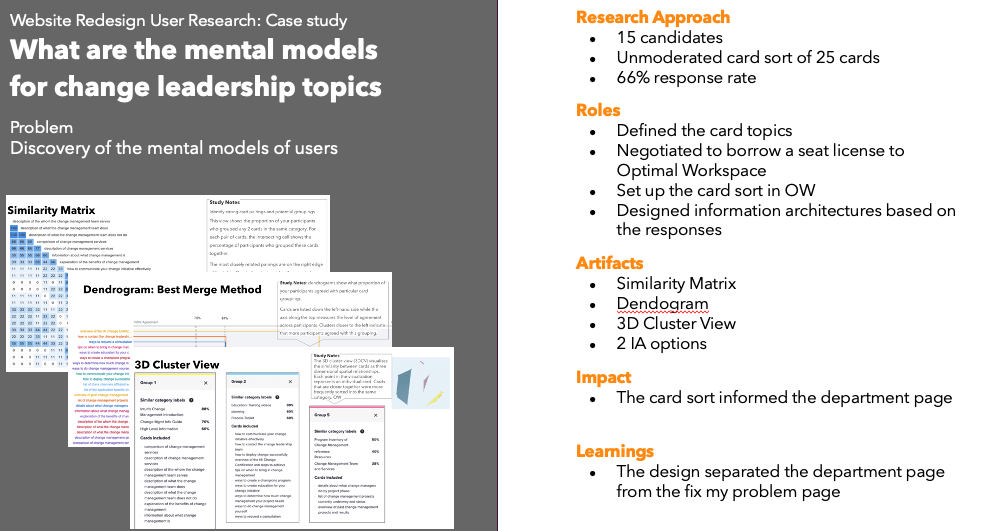
Lots of abstract language and nominalizations meant we needed to change the way the information was organized and labeled. I used a card sort method to inform the decision.
Example: Case Study 3
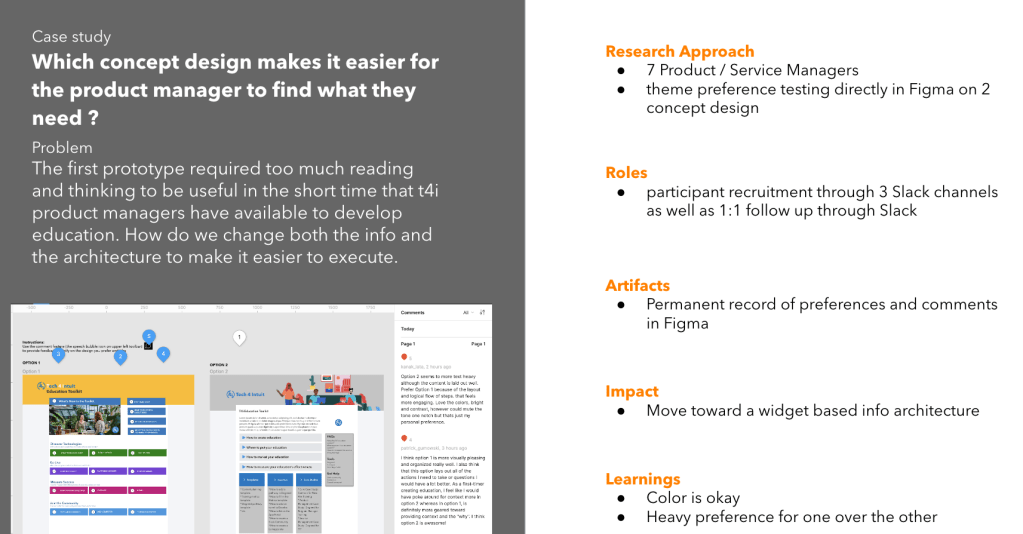
I shared prototypes with users and asked for their comments and feedback in Figma.
Outcome/impact/benefit
Product and Service Managers now had a consistent process to follow by referring to the toolkits. The toolkits were frequented and each visit deferred a question from the Product Manager, Service Manager, or Support Team.